Having just come back from my first Four Days in May, hosted by QRP-ARCI, I have a lot to talk about. My first FDIM really exceeded my expectations; true, the Dayton Hamvention is an impressive event, but the activities and meeting the people at FDIM really made this first trip memorable. If you are interested in QRP or homebrewing gear, I can’t recommend it strongly enough.
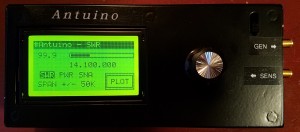
There were a number of events I want to tell you about, but in this post I want to describe a new piece of test gear I brought back, which will really change the way I work with home brewed radios. This test instrument is called the Antuino, presented by Ashhar Farhan of uBitx fame. It places within reach of the amateurs’ budget circuit analysis of amplitude vs. frequency, formerly the domain of very expensive service monitors and network analyzers.
The Antuino is powered by an Arduino Nano v3, and consists of these functional blocks:
- an SWR bridge
- a calibrated receiver
- an si5351 signal generator
- an Arduino Nano
- a 128×64 LCD graphical display, and encoder/pushbutton.
Using these blocks, under the control of the Nano, the Antuino provides the following functionality
- a graphical antenna analyzer, plotting SWR vs. frequency
- a scalar network analyzer, which lets you plot the frequency response of passive circuits, such as filters
- a relative power analyzer, showing received signal strength vs. frequency
If you have ever wanted to check for spurious emmissions from your homebrew transmitter, check the response of a low pass filter, or just figure out the 2:1 SWR bandwidth of you antenna, this is the instrument for you. And all, in the true uBitx tradition, it will do it at about a $100 price point. You can’t beat that for functionality per dollar.
We all got excited about the Antuino when Ashhar gave a short presentation on it during the Thursday talks at FDIM, the the excitement really peaked when we found out that there were a large number of first production run instruments available for sale at Vendor Night, Thursday evening. A large line formed, but there were enough to go around, and I felt quite lucky to have been able to snag one. My understanding is that they will go on sale to the general public on June first, from the HF Signals website.
Of course, these are first run units, so they were not without a few minor warts out of the gate, (like the uBitx had.) There is virtually no documentation online yet, other than the schematic and the source code which is open source and hosted on github. (Ashhar mentioned that a software update will be available shortly providing some minor improvements.) The intent is to make the platform easily hackable, and I already have some ideas I want to try out.
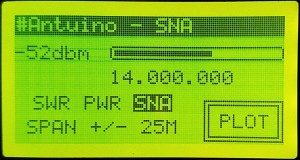
Antuino is supplied in a plain black case without any markings or labels (I added my own), but applying power brings up the LCD display which tells the entire story. The key piece of information needed is that the SMA female connector near the centerline of the device is used for all inputs, the one near the top of the case is the output of the signal generator, used only for the SNA function. There is a mini-USB jack for programming the Nano, a 2.1mm barrel jack for input power, 9 – 12v, and a power switch on the top of the case. The rest of the UI is in the software.
There was a minor hardware issue with these first run units that a lot of folks ran into, myself included. The case contains a 6-cell AA battery tray – a full set of batteries will power the unit for about 4 hours. However we could’t get the unit to run from the batteries. Removing the board and resoldering the pins of the barrel jack above and below the board, and also the pins of the connector from the battery tray to the board solved all battery operation issues. I’m using NiMH batteries in mine, and it is very convenient to not have a power connection trailing the instrument.
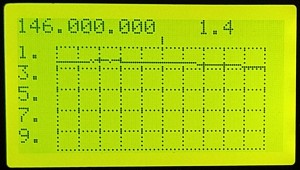
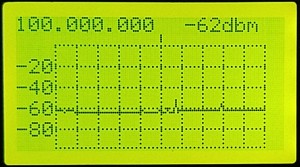
My first Antuino experiments were hotel room-based, and consisted of checking the SWR of a 2 meter HT antenna (yes, the frequency range of the si5351 extends up 2m) and scanning the FM broadcast band with the HT antenna attached. The SWR plot looked believable if not very interesting, and there were definitely some peaks in the FM band that appear to correspond to strong local stations. But more interesting testing had to wait until I got home.
Sweeping your antenna for SWR is very simple:
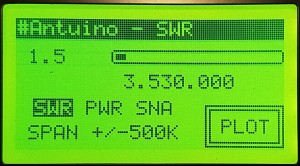
- use the encoder to move the highlight to the segments of the frequency display and select your center frequency for the scan by pressing the encoder to enter the field, turning the encoder to select the value, and pressing again to exit the field.
- move the highlight to SWR and press the encoder to select.
- move the highlight to the frequence range and select the width of scan
- at this point the bar display shows the instantaneous value being measured
- move the highligh to the PLOT button (it has a double frame when selected) and press the encoder to start the scan
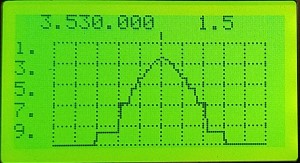
The setup screen is replaced with a chart showing SWR vs. frequency. Press the encoder again to exit the chart back to the home screen. Here is a scan of my G5RV on 80 meters.
Using the SNA (Scalar Network Analyzer) function is also straightforward. Connect the upper SMA connector to the input of the circuit you wish to scan, and the output of the circuit to the sense input (central SMA connector.) Using the home screen, set you frequency, select the SNA function and bandwidth, and press PLOT.
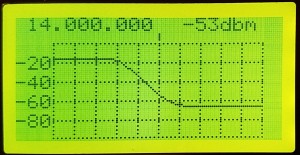
The resulting plot will show the response of your circuit in dbm over the frequency range. Here is a plot of a low pass filter designed for 40 meters, which I use with my WISPR transmitter:
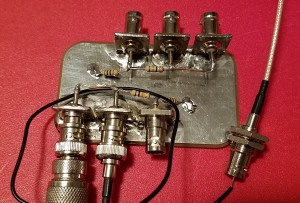
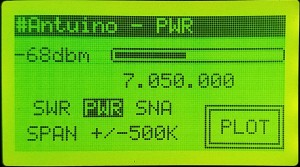
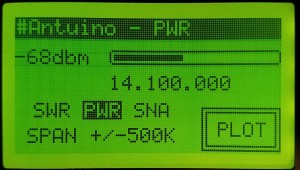
Now we get to the calibrated receive function of the Antuino. The key thing here that you have to be careful not to overload the receiver, you cannot connect your transmitter directly to it. Above 1mw input the receiver is swamped and basically does not display any signal. Higher power levels could damage the receiver. I tried to use a resistor network with a dummy load as a sniffer, but I could’t get the signals down into a readable range. I suspect there was a lot of leakage in addition to the voltage on the resistor network. What worked very well was about a foot of plain wire stuck into the female connector and draped over the sniffer and the dummy load I was transmitting into. This brought the signals down into a measureable range.
Although it is tempting to set the scanning range to a large value, like +/- 25MHz to look for spurious emissions from a transmitter, I found that this did not work very well, as the signal measured at the primary frequency was very low compare to that measured at say +/- 500kHz. My guess is that this is because there are probably a fixed number of steps in the graph, and at the wide scan you are probably stepping right over the fundemental frequency you are interested in. This theory could be confirmed by looking at the code, which I have not done yet.
A better approach is to use a relatively narrow range around the fundemental, make note of the peak value, and then perform the scan at the second, third etc. harmonic frequencies and compare results. A little cumbersome, but it works.
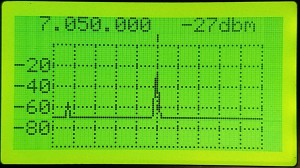
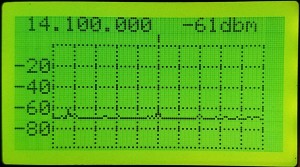
Here is the plot from my SKY-SDR at 7.050 MHz, and also at 14.1 MHz.
At 14.1 MHz the second scan looks close to 40db down compared to the first, which is what we would hope for.
Right out of the gate, the Antuino is proving to be an interesting and useful tool in the shack, and I’m sure it will only improve as the software evolves and folks come up with new and novel applications for it.
Keep your eye on the HF Signals website, and till next time
73
de N2HTT



Hoping Ian of Hamskey.com will write some software. I’d like to use a nextion on the current hardware and he’s able to set that up like he did for the uBITX. Then, possibly wishing here, but I’d like to use a smith chart. It could be slow but that would be ok. I’d like it to scan multiple scans . I’ve seen it done but the guy who did it used a different micro-controller and I’d like it done with the Nano.
After you get a graphical display, notice at the center of the top line there is a cursor. You can move the cursor with the tune knob and see the readings at that point.
Raj, vu2zap
Thanks Raj, works great! 73 Mike